Opinion: Bears control the stock market for now, but these takeover plays can keep the bulls satisfied
[ad_1]
The stock market, as measured by the S&P 500 Index
SPX,
has continued to decline after its false upside breakout of early February. February is statistically the worst month of the year, and this February just concluded was certainly a negative month – although it remains to be seen if it will be the worst month of this year.
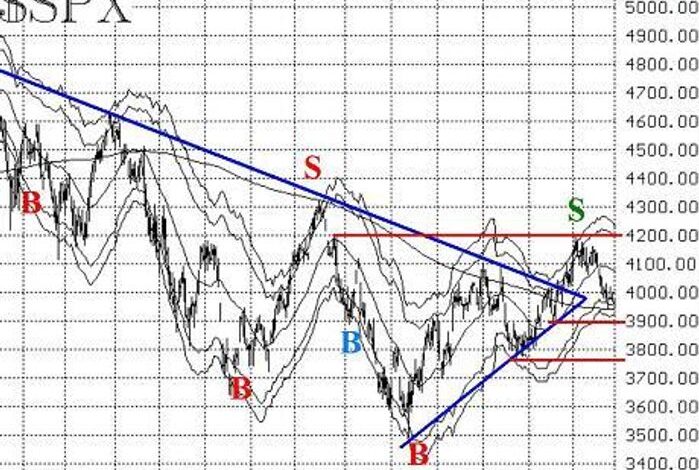
SPX has been under pressure since that false breakout. There is minor resistance at 4020 and then heavy resistance from 4080 up to 4200. On the downside, there is support at 3900, and stronger support from the late-December trading range between 3760 and 3850.
Also, the fact that SPX broke out from a triangle formation (blue lines on accompanying chart) only to fall back below the apex of the triangle is a further negative.
The McMillan Volatility Band (MVB) sell signal remains in effect. SPX has traded down to and touched the -3σ “modified Bollinger Band.” The target for the MVB sell signal is the -4σ Band, which is currently at about 3920 and moving sideways for the moment.
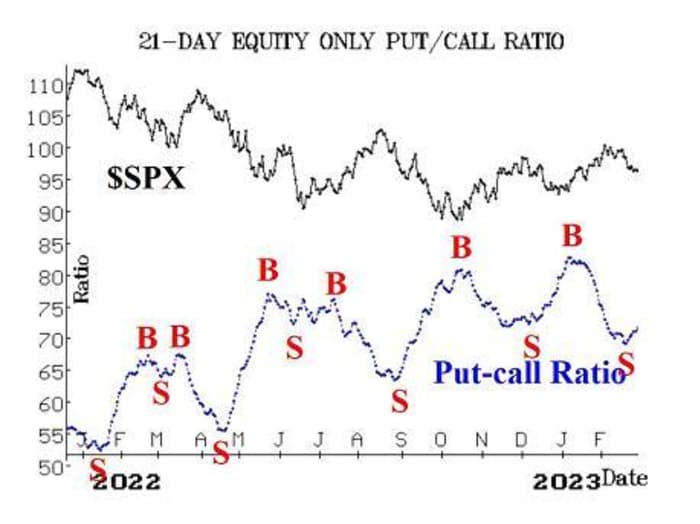
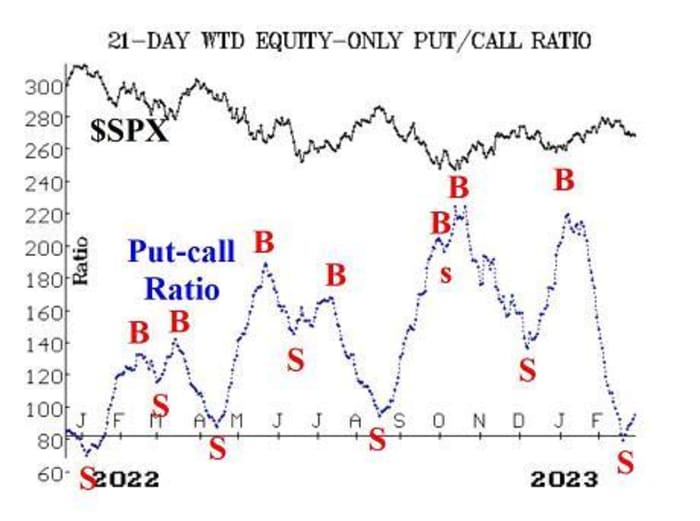
Equity-only put-call ratios remain strongly on sell signals. They curled over recently and began to rise. Our computer analysis programs confirm that both are on sell signals now. The weighted ratio’s signal came from a very low position on its chart — i.e., from an extremely overbought condition. That normally indicates a strong signal.
Market breadth has been generally negative, and both breadth oscillators have suffered. There has been more damage to the “stocks only” breadth oscillator, though, and it remains on a sell signal (albeit in oversold territory). The NYSE breadth oscillator has completed a buy signal. The two oscillators have spread apart, and that is an oversold condition for stocks as well. We are going to wait for some agreement here before taking a new position, since the “stocks only” oscillator is usually the more reliable signal.
New 52-week highs on the NYSE have been just strong enough to avoid a sell signal. On a couple of days, New Lows have exceeded New Highs, but not on back-to-back days. So, for the moment, this indicator remains on its buy signal.
VIX
VIX,
has generated a new “spike peak” buy signal. It peaked on Feb. 22 in overnight trading. It then took five trading days for it to fall three points below that peak, which is the criterion for a new buy signal. This buy signal will remain in effect for 22 trading days, but would be stopped out if VIX were to close above that peak — i.e., above 23.63.
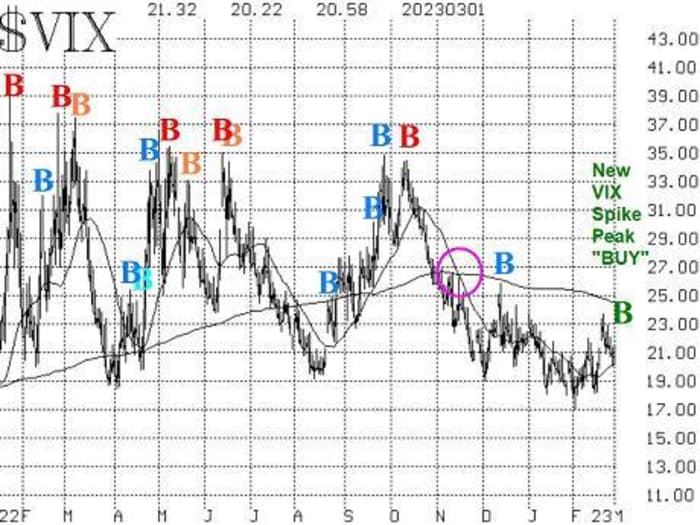
The trend of VIX intermediate-term buy signal remains in effect. It began last November (circled area on the accompanying VIX chart). It would be stopped out if VIX were to close above its 200-day moving average, which is currently at 24.80 and declining.
The construct of volatility derivatives remains modestly bullish for stocks. That is, the term structures of both the VIX futures and of the CBOE Volatility Indices continue slope upwards. Furthermore, the VIX futures are all trading at premiums to VIX.
Overall bullish arguments seem to ride on sort of vague statistics. Here’s one that was making the rounds: When January is up by more than 4% and February is down by more than 2% (both of which occurred this year), that is bullish for stocks. Apparently this has happened a handful of times. Even if you want to trade on a statistic with such a short track record, how would one even trade that? I’d rather use the indicators with track records, which will get us long on stocks if the market does reverse upward.
In summary, we are maintaining a “core” bearish position because of the false upside breakout experienced by SPX in February and because of the equity-only put-call ratio sell signals. We will trade other confirmed signals around that “core.”
New recommendation: Terran Orbital (LLAP)
Option volume in Terran Orbital
LLAP,
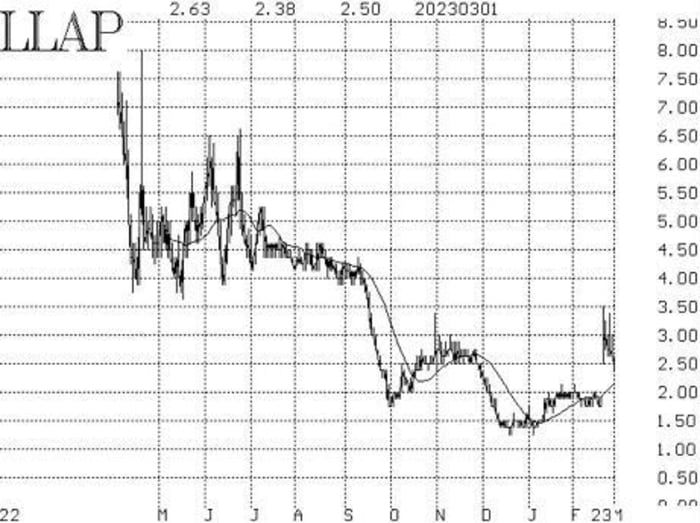
rose sharply on Feb. 22 and has remained quite strong since them. Moreover, stock volume patterns are extremely strong. One could consider merely buying the stock and not bothering with an option, but we are going to use calls here:
Buy 10 LLAP Apr (21st) 2 calls
At a price of 0.70 or less.
LLAP: 2.40 Apr (21st) 2 calls: 0.55 bid, offered at 0.70.
Stop out if LLAP closes below 1.90.
New recommendation: Seagen Inc. (SGEN)
Option volume in Seagen
SGEN,
has been elevated for the past three days. There is talk that Pfizer
PFE,
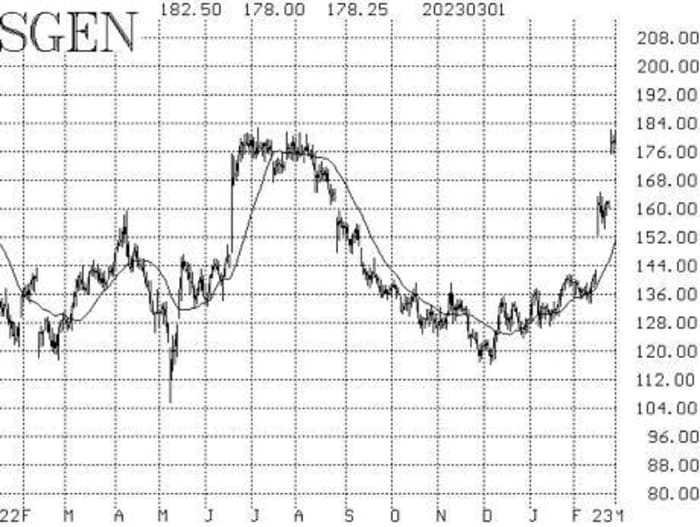
is in early-stage discussion to acquire SGEN. Stock volume patterns are very strong, as well. Since these are expensive options, we are going to recommend a spread here:
Buy 1 SGEN Apr (21st) 180 call
And Sell 1 SGEN Apr (21st) 200 call
For a debit of 7.00 or less.
SGEN: 177.03
We will hold without a stop initially while this takeover rumor plays out.
Follow-up action:
We are using a “standard” rolling procedure for our SPY spreads: in any vertical bull or bear spread, if the underlying hits the short strike, then roll the entire spread. That would be roll-up in the case of a call bull spread, or roll-down in the case of a bear put spread. Stay in the same expiration, and keep the distance between the strikes the same unless otherwise instructed.
Long 1 SPY
SPY,
Mar (17th) 410 call and Short 1 SPY Mar (17th) 425 call: This spread was bought in line with the “New Highs vs. New Lows” buy signals. It was rolled up on January 26th, when SPY traded at 404, and then it was rolled up again at expiration. Stop yourself out of this position if New Lows on the NYSE exceed New Highs for two consecutive days.
Long 3 XM
XM,
Mar (17th) 15 calls: Continue to hold while the takeover rumors play out.
Long 1 SPY Mar (17th) 410 put and Short 1 SPY Mar (17th) 385 put: This bear-spread was bought in line with the McMillan Volatility Band (MVB) sell signal. This trade would be stopped out if SPX were to close back above the +4σ Band. SPX touched the -3σ Band this week, but not the -4σ. Roll the spread down 16 points on each side, staying the March (17th) expiration.
Long 2 CTLT
CTLT,
Mar (17th) 70 calls: This takeover rumor is still “in play,” although the stock has fallen back slightly. Continue to hold while these rumors play out.
Long 3 MANU
MANU,
Mar (17th) 25 calls: The potential takeover has hit a snag, in that the current owners think the team is worth far more than analysts can justify. We are going to hold.
Long 2 GRMN
GRMN,
April (21st) 95 puts: These were bought on Feb. 21, when GRMN closed below 95. We will remain in this position as long as the GRMN weighted put-call ratio remains on a sell signal.
Long 2 SPY April (21st) 390 and short 2 SPY April (21st) 360 puts: This is our “core” bearish position. Initially, we will set a stop to close out this position if SPX closes above 4200.
Long 1 SPY Apr (6th) 395 call and Short 1 SPY Apr (6th) 410 call: This call bull spread was bought in line with the VIX “spike peak” buy signal. It was confirmed at the close of trading on Wednesday, March 1st. Stop out if VIX subsequently closes above 23.73. Otherwise, we will hold for 22 trading days.
All stops are mental closing stops unless otherwise noted.
Send questions to: lmcmillan@optionstrategist.com.
Lawrence G. McMillan is president of McMillan Analysis, a registered investment and commodity trading advisor. McMillan may hold positions in securities recommended in this report, both personally and in client accounts. He is an experienced trader and money manager and is the author of the best-selling book, Options as a Strategic Investment. www.optionstrategist.com
©McMillan Analysis Corporation is registered with the SEC as an investment advisor and with the CFTC as a commodity trading advisor. The information in this newsletter has been carefully compiled from sources believed to be reliable, but accuracy and completeness are not guaranteed. The officers or directors of McMillan Analysis Corporation, or accounts managed by such persons may have positions in the securities recommended in the advisory.
[ad_2]
Source link


